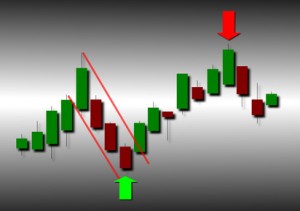
 When trading binary options, there are two key types of analyses. These include technical analyses and fundamental analyses. Both types have distinct advantages, and oftentimes it is in using a combination of each that can help a trader to best determine how to hedge their trades.
Many binary options traders use technical analyses in determining the potential future price movements of the underlying assets. In most cases, technical analyses is better used for binary options with shorter-term expiry durations such as 60 seconds up to several hours – although such charts can also be helpful in plotting the potential price of the underlying asset for longer periods of time as well.
Types of Technical Analyses
When using technical analyses to determine the potential price movement of an underlying asset, binary options traders can typically use time price charts and volume price charts. Price charts may be used to help in tracking the movements of all different types of underlying assets, regardless of whether these are commodities, currency pairs, individual stocks, or market indices.
There are also a number of different types of charts, such as bar charts, line charts, and histograms. However, all of these will typically plot the price of the underlying asset either by volume or by time.
Time Price Charts
A common type of technical analyses involves the use of time price changes. These charts will plot the various price movements of the underlying asset over a certain period of time. The choice of the time price chart that a trader uses will depend upon several factors, including the type of trader, as well as the duration of the binary options expiry.
As an example, for traders who take on short-term trades, price changes at 60-minute intervals or less can help in predicting the price movements that are likely to occur within the next one-hour period of time.
Traders who deal with longer-term transactions may be better to study price changes that have been plotted on a daily or weekly basis. In these cases, traders may wish to see the open price of the underlying asset at the beginning of the period, along with the high and low prices both during and after the end of the time period.
Volume Price Charts
Traders may also opt to study price movements by the amount of volume that has taken place in the trading of the underlying asset. Volume price charts will plot a particular price level after a certain number of contracts have been made or a certain amount of a commodity has been traded. These charts will oftentimes have fewer entries, and will therefore have more of a focus on times when the trading levels are more normal.
When the volume of a particular underlying asset is low, it is possible that sudden changes in price could occur if large trades are undertaken on that asset. In addition, an increase or decrease in the volume of trading can be a signal that the price of the underlying asset is likely to move up or down in the near term.
Likewise, the end of a market move is oftentimes indicated by an increase in volume that will reach a peak and then suddenly drop. Any signs such as changes in an assets volume are important to note as short-term price movements in the underlying asset are likely to occur.
Many of the exchanges that trade commodities and other types of underlying assets will provide information about the volume of trading as well as the number of option contracts that have been traded during a certain period of time. Regardless of the type of chart that is used by a trader, however, it is always more useful if the data is up-to-date and in as close to real time as possible.
Popular technical trading patterns
Techincal trading patterns come in all sorts of shapes and sizes. Some take several months to form whilst others can be seen on a 1 minute price chart. The length of time that these patterns take to form are an indication of how influential they are likely to be and will help to determine the expiry time of the binary options. The most reliable technical price patterns are also the most popular. These include ‘double tops’ and ‘double bottoms’ as a favoured reversal pattern used by many traders. This pattern forms when price makes a high or a low, pulls back and tries once again. The failure for the price to move any higher of lower on the second attempt creates the potential setup and when this price reverses beyond the original pullback it confirms that a new trend in the opposite direction is highly probable.
Another popular pattern used by technical traders is the head and shoulders and ‘triple top and bottom’ reversals. Similar to the double top and bottom signals these both form a triple attempts for price to push higher or lower before eventually giving up and reversing. All of these technical patterns can be backed-up and confirmed by using a technical indicator. These indicators are applied to price charts and cna show the strength or weakness of the current price as well as the likely momentum in the future. Combining chart patterns and technical indicators can pinpoint some excellent binary options trading opportunities in advance of the price moving in the indicated direction.

